Design your KPI tree by combining indicators through automated consolidation.
This article guides you in setting up consolidation.
Warning:
Only room administrators can configure consolidation.
To create a consolidated view:
Create a recipient indicator.
Each declared indicator can be configured to receive values from a consolidation.
Warning:
A binary indicator cannot be a recipient indicator.
Click the consolidation icon.
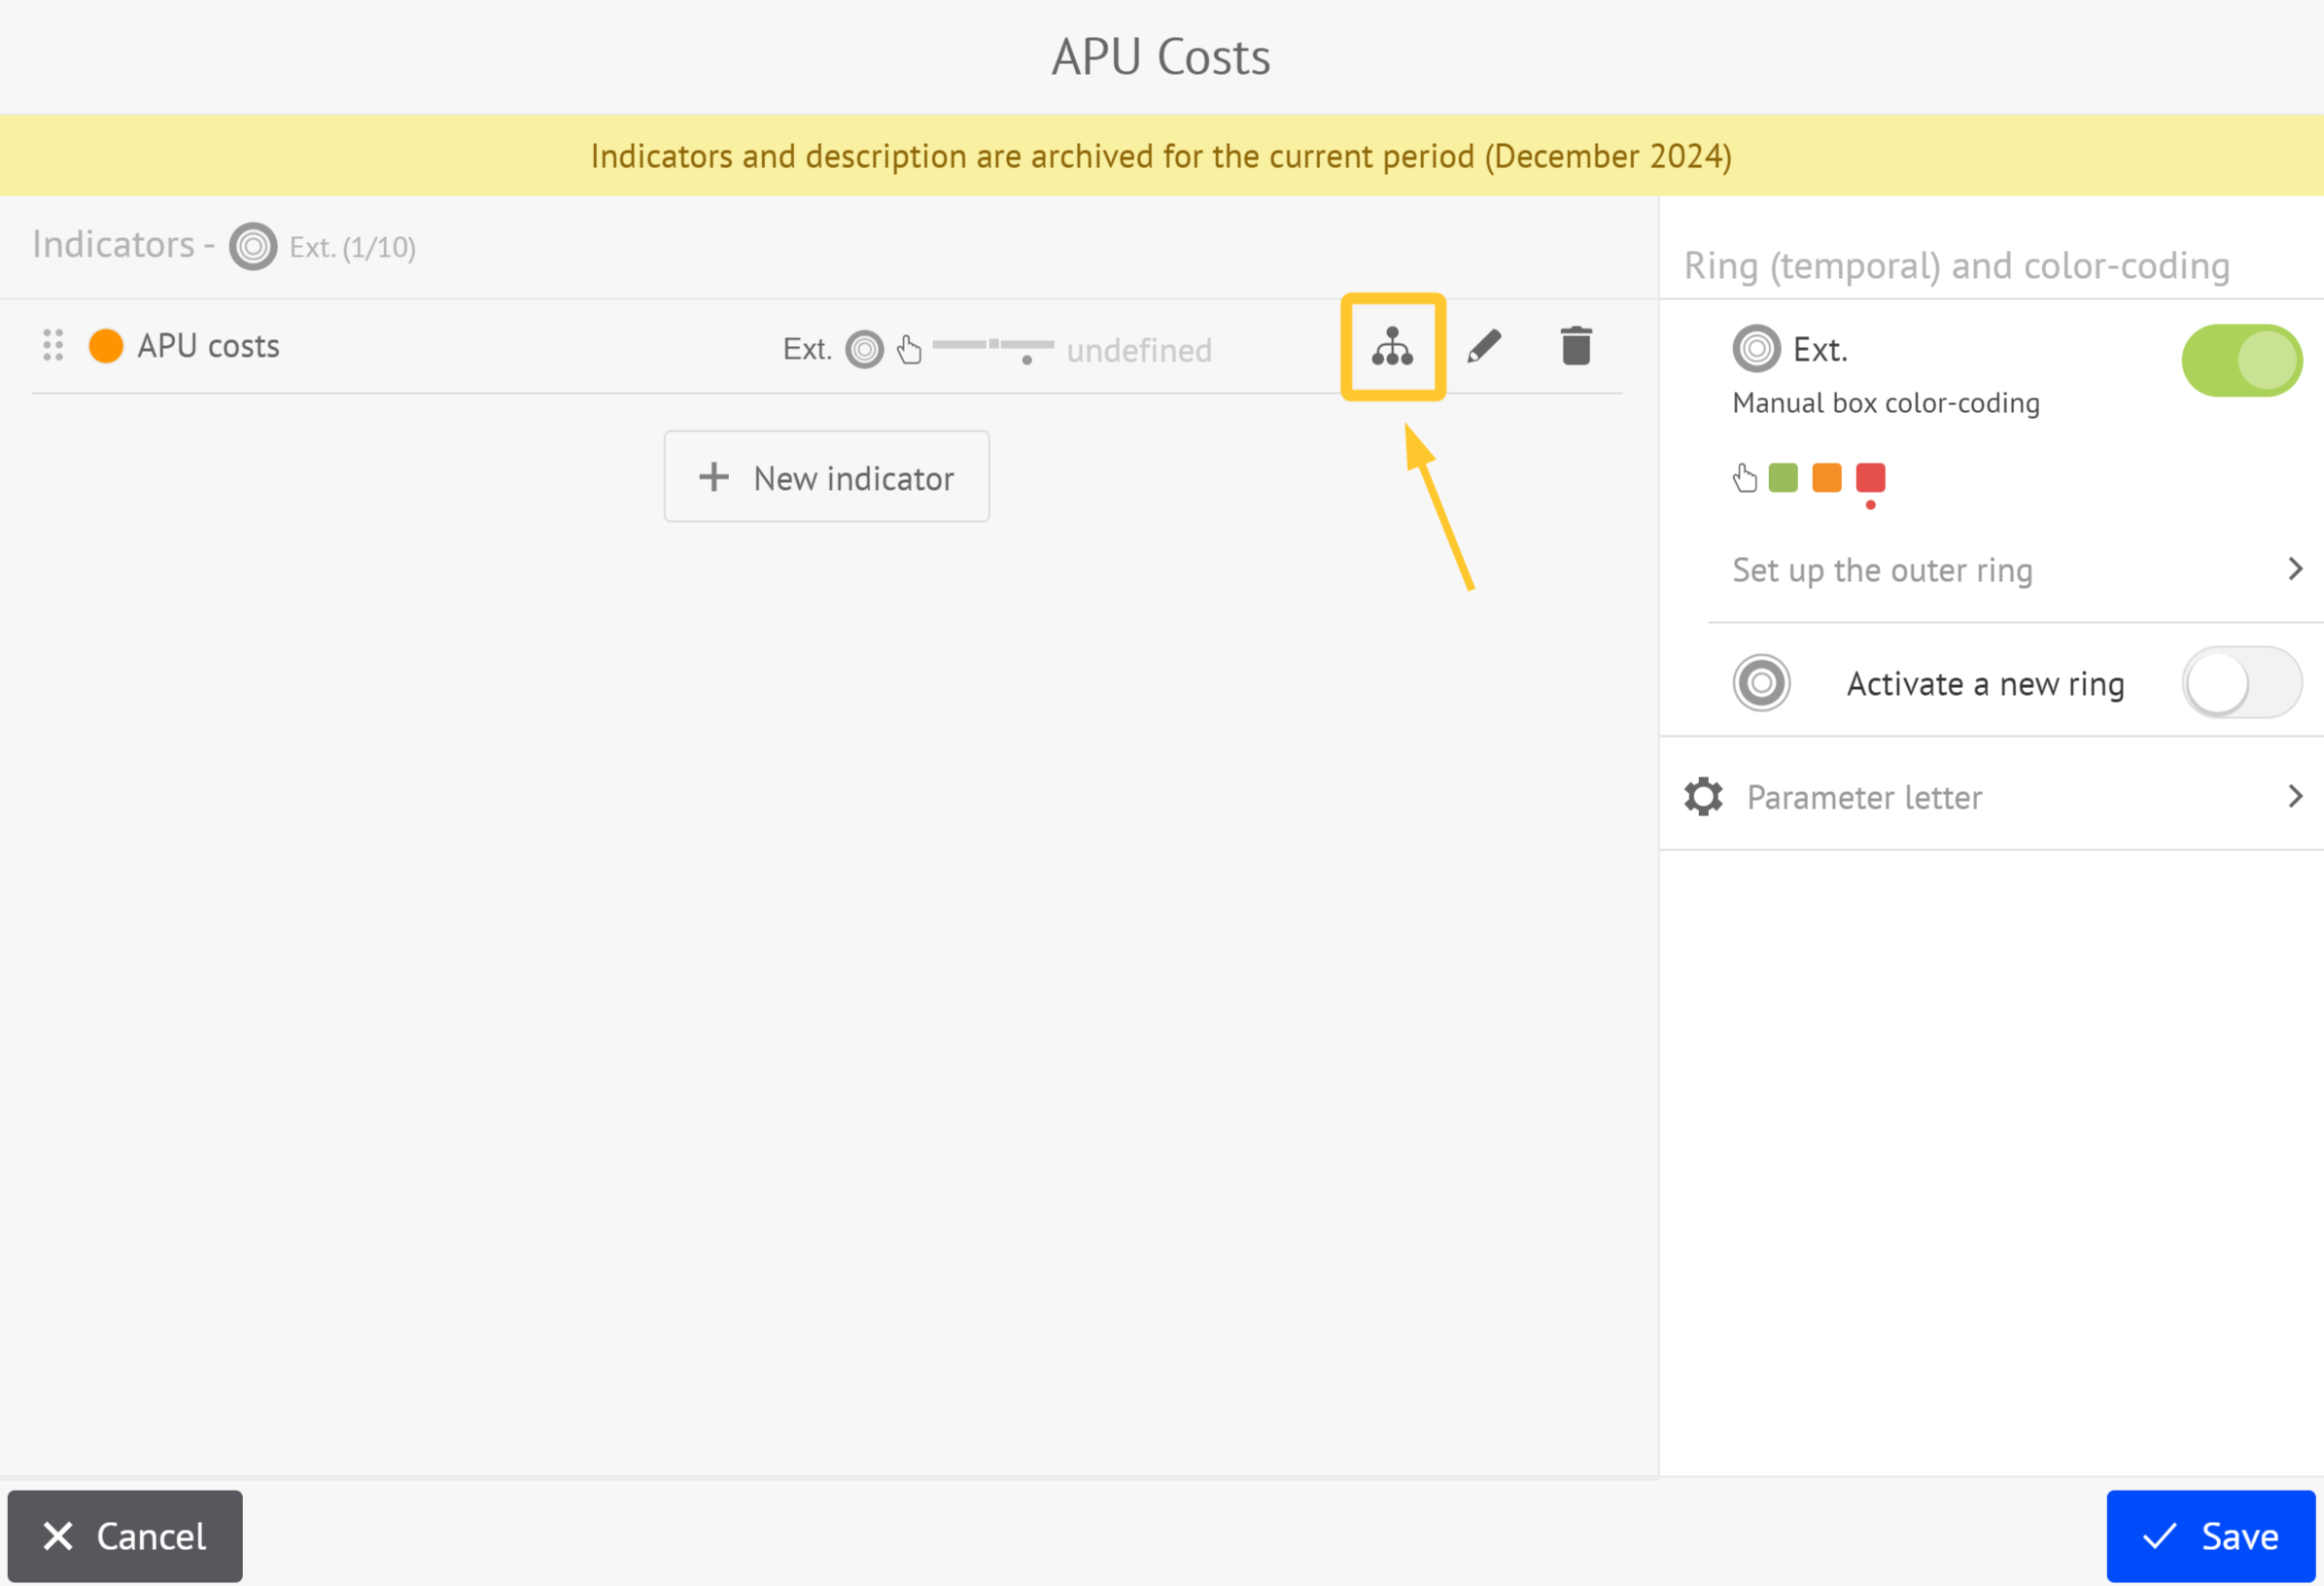
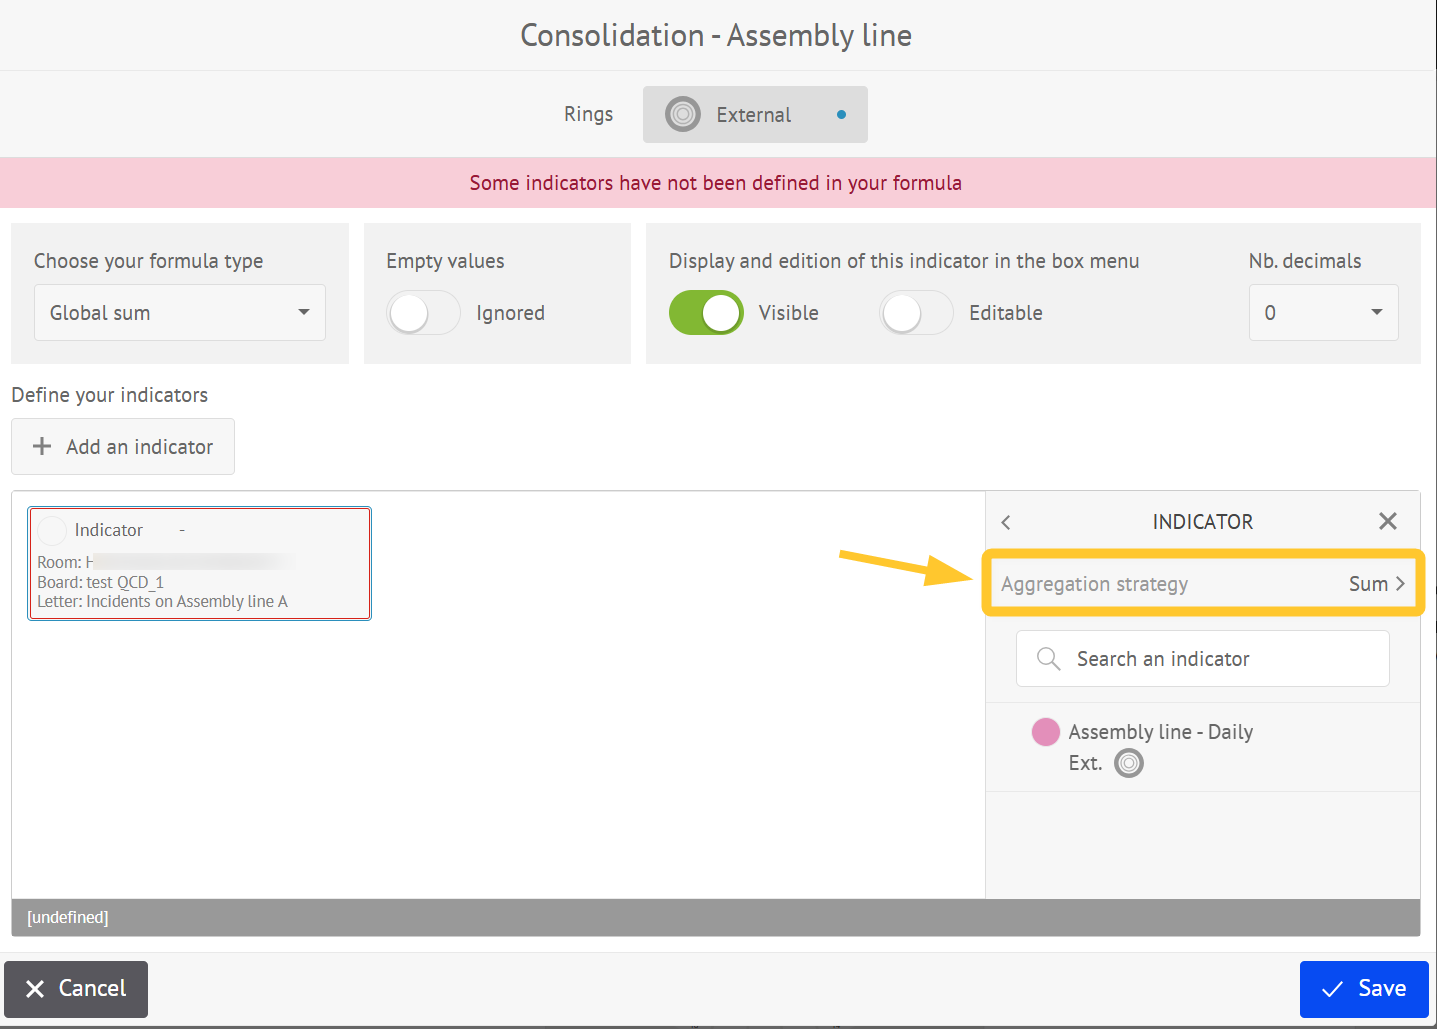
The consolidation configuration interface is displayed:
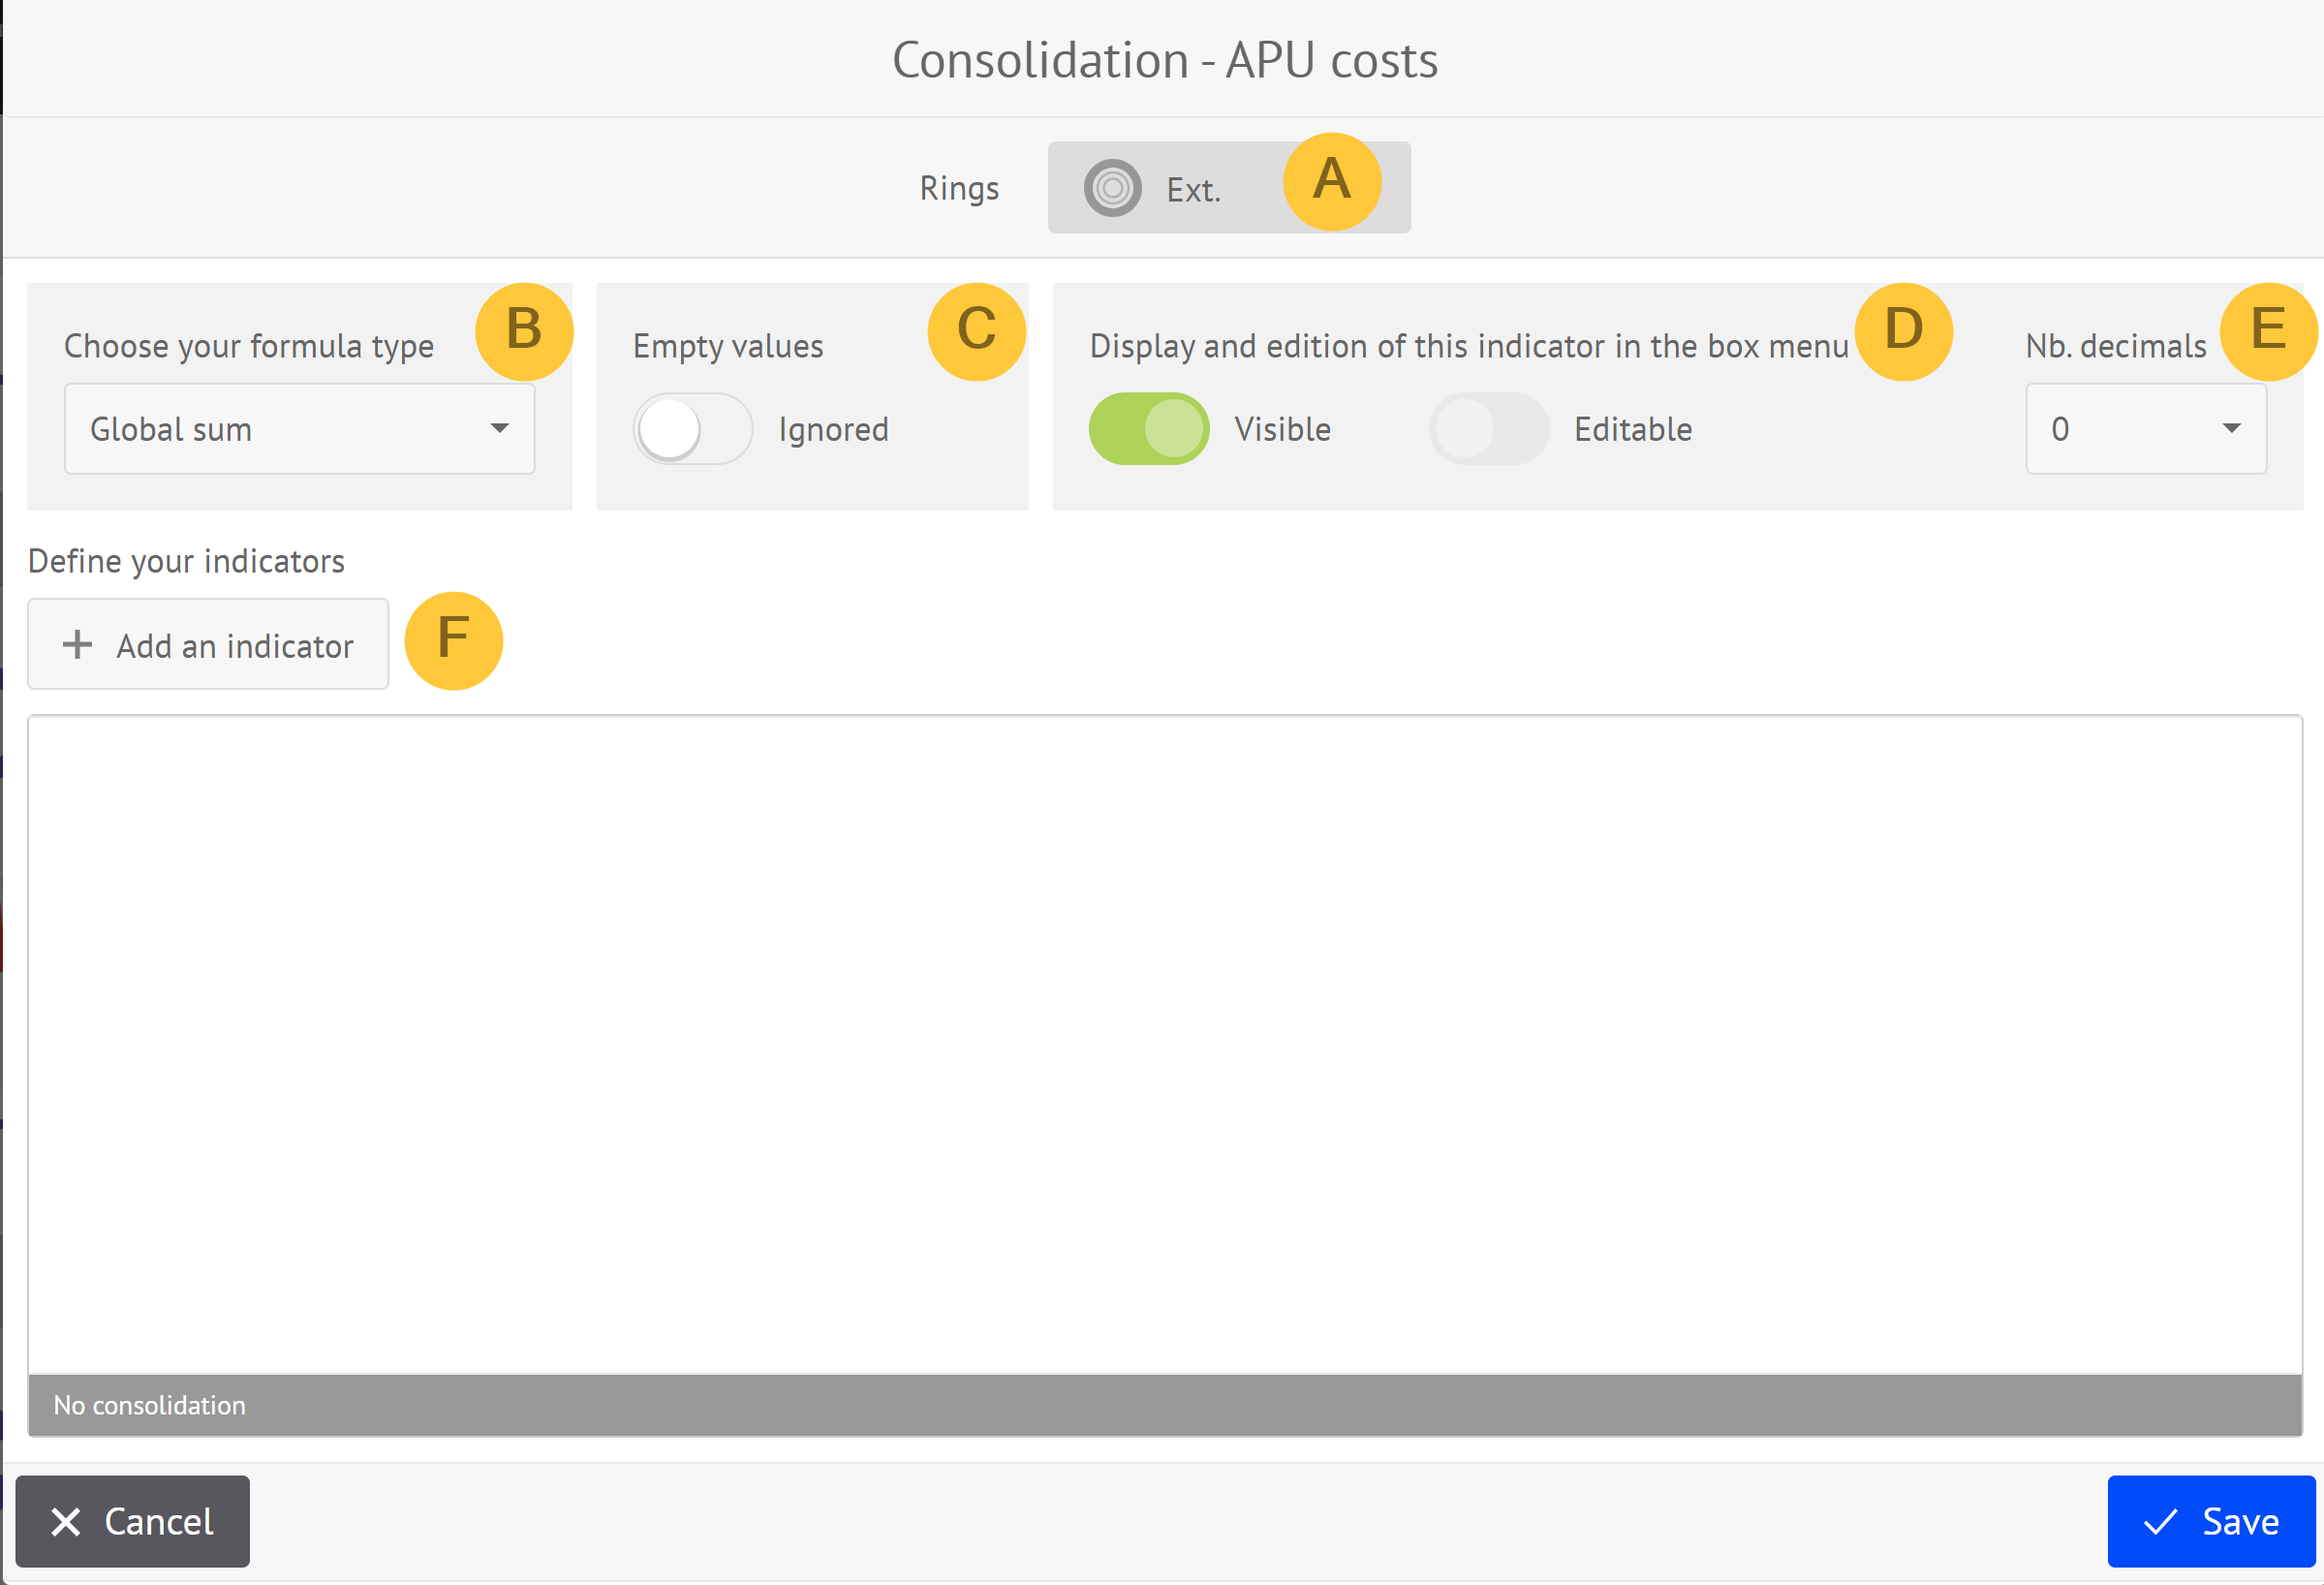
Selection of the ring
Selection of the formula type
Selection of whether to consider empty values in the fields
Selection of visibility and editability of the value after consolidation is calculated
Selection of the number of decimal places to display after consolidation is calculated
Definition of source indicators
Define the consolidation formula.
Available Formulas
Five consolidation formulas are available:
Global sum:
The recipient indicator receives the sum of the values of source indicators.
Simple average:
The recipient indicator receives the average of the values of source indicators.
Note:
If one or more source indicators have a missing value, they are ignored in the calculation.
For example, if we consolidate 8 indicators and one of them has a missing value, only 7 values are considered.
Minimum:
The recipient indicator retrieves the minimum values of each source indicator.
Maximum:
The recipient indicator retrieves the maximum values of each source indicator.
Custom
With the custom formula you are free to define any formula by combining arithmetic operators with source indicators and fixed numbers with a simple click or a drag&drop.
Tips:
To calculate the MIN and MAX of several indicators, use a comma to separate the indicators.
The syntax of the formula must be correct. If not, a red error message is displayed and the formula is not taken into account
Formula Elements by Type of Formula
Recipient Indicator:
Every source indicator:
is defined with the following path: room → board → letter → ring
may follow a time aggregation rule.
Type of formula selection:
Sum: Yes
Average: Yes
Maximum: Yes
Minimum: Yes
Custom: Yes
Arithmetic operator:
6 basic operators::
Brackets ( )
Arithmetic: sum +, subtraction - , multiplication *, division /
Type of formula selection
Sum: No
Average: No
Maximum: No
Minimum: No
Custom: Yes
Fixed number:
Fixed numerical value entered manually
Type of formula selection
Sum: No
Average: No
Maximum: No
Minimum: No
Custom: Yes
Define the source indicators.
To define the source indicators
Click + Add an indicator.
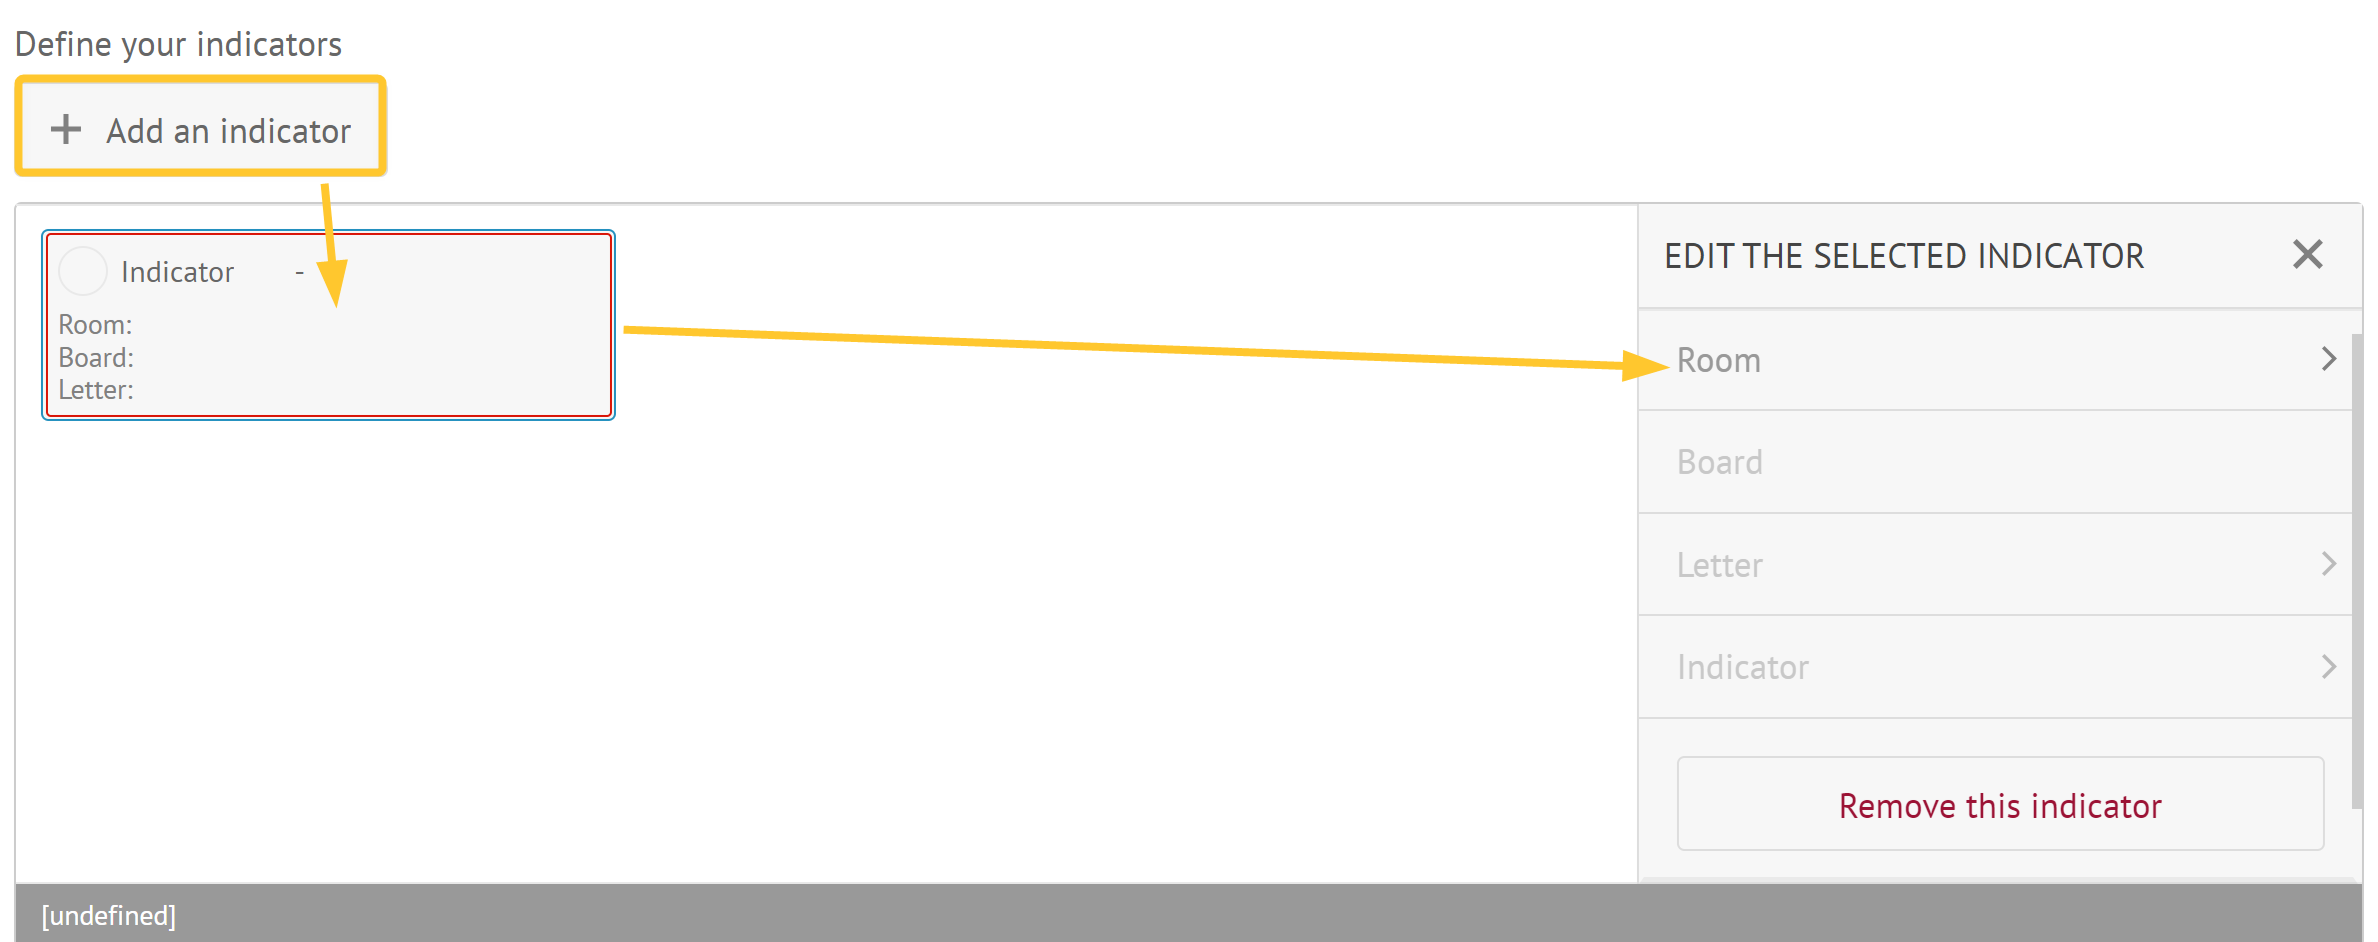
Select the information regarding the source indicator: room, board, letter and relevant indicator
You can:
add as many source indicators as you want: Repeat steps 1 and 2.
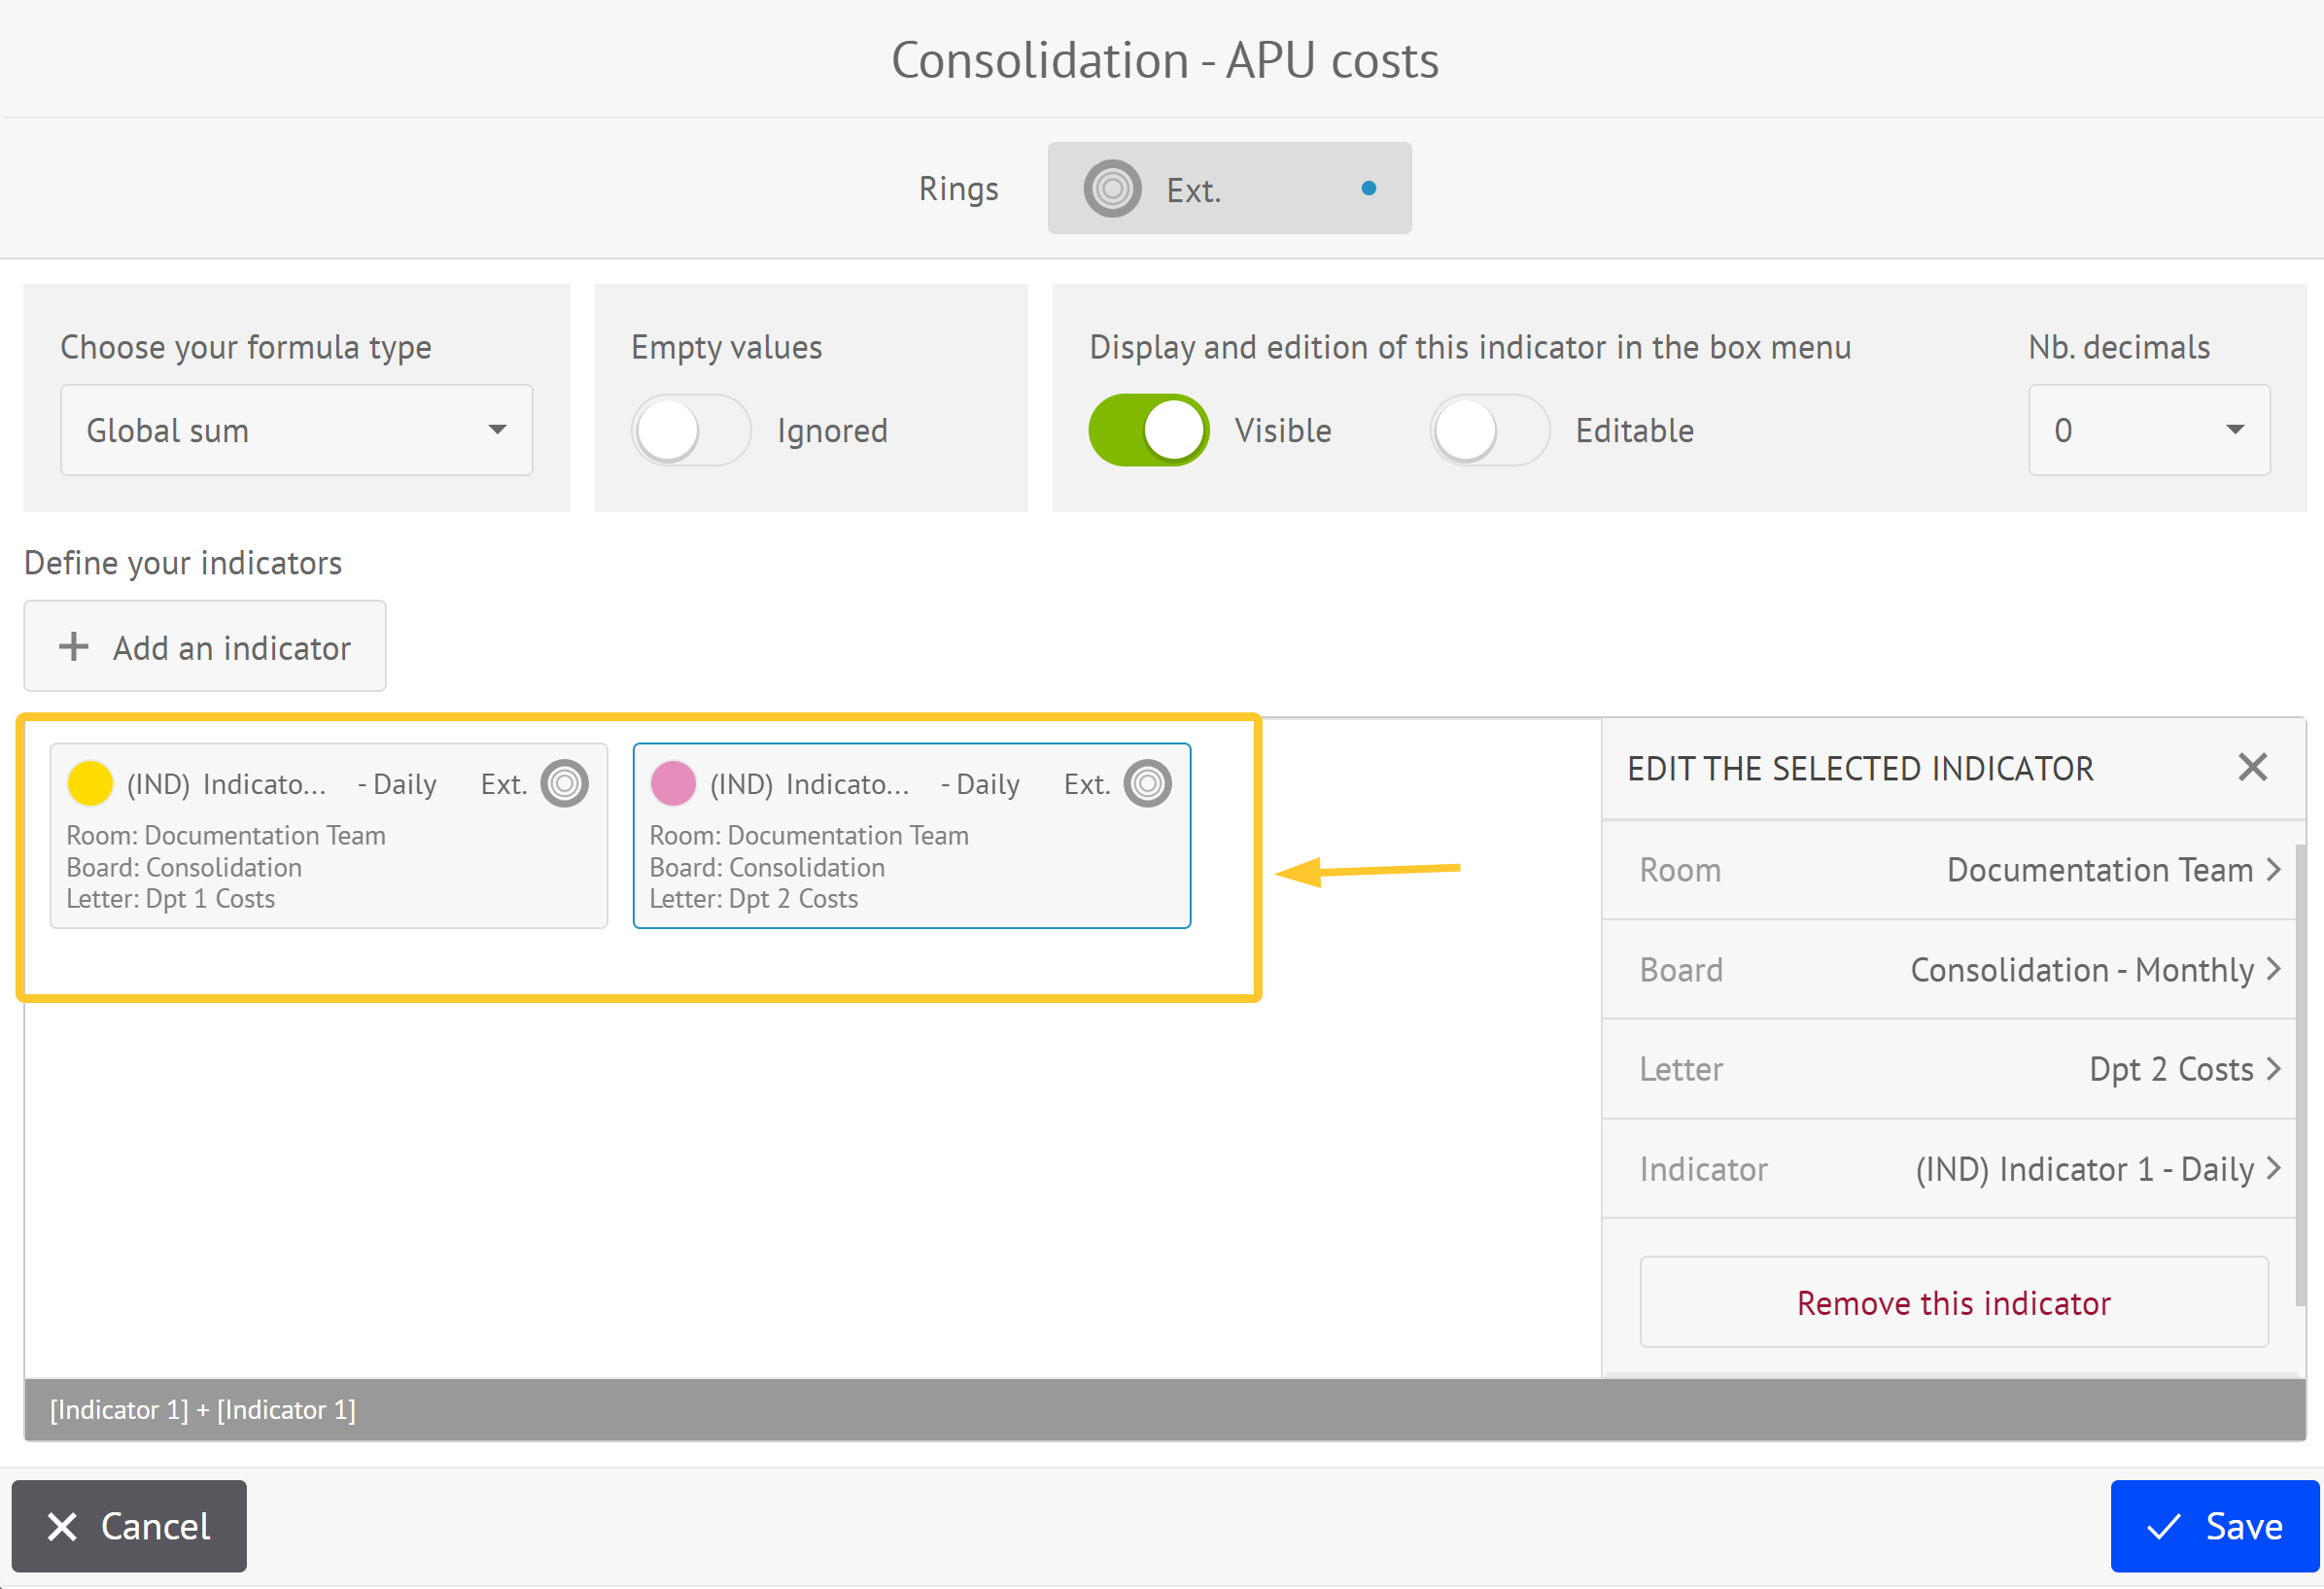
remove a provided indicator: click Remove this indicator.
Managing Source Indicators
Target and Recipient Ring Frequency Compatibility
You cannot select a source indicator positioned on a ring with a frequency higher than the frequency of the ring containing the recipient indicator (e.g., consolidating a quarter into a month).
Time Aggregation Rules
During consolidation, indicator values can come from different time windows. In this case, the source indicators have a lower time window than the recipient indicator. Multiple source values are aggregated to produce a single value that fits the time window of the consolidated indicator.
Example
Daily indicators can be combined to produce a weekly total or average.
Weekly indicators can be combined to produce a monthly value.
In this case you have the choice between:
sum: sum all selected source indicators.
average: average the selected source indicators.
min: show the lowest value among selected source indicators.
max: show the highest value among selected source indicators.
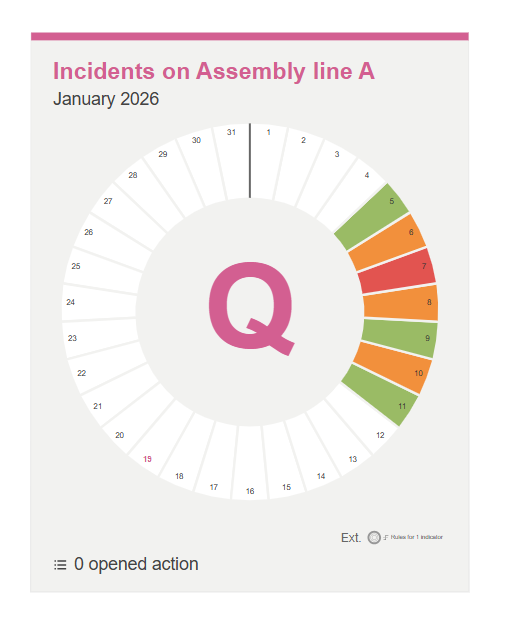
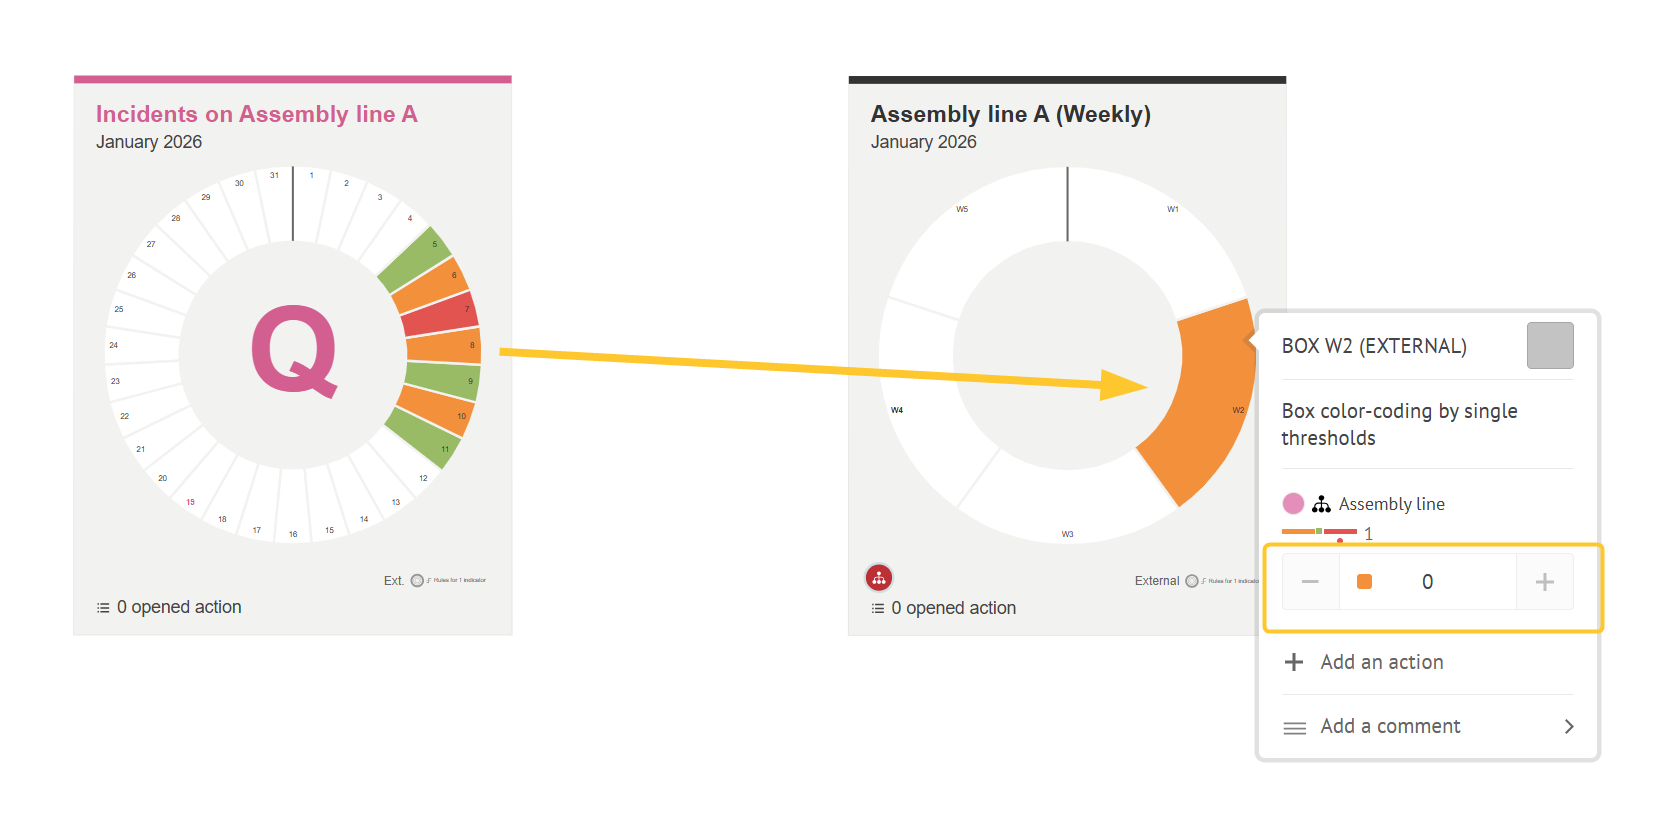
Example:
Suppose you have a source indicator called Incidents on Assembly Line A with a daily time window:
Mon = 1, Tue = 0, Wed = 2, Thu = 0, Fri = 1, Sat = 0, Sun = 1
To aggregate these daily values into a weekly recipient indicator, you can apply the following aggregation methods:
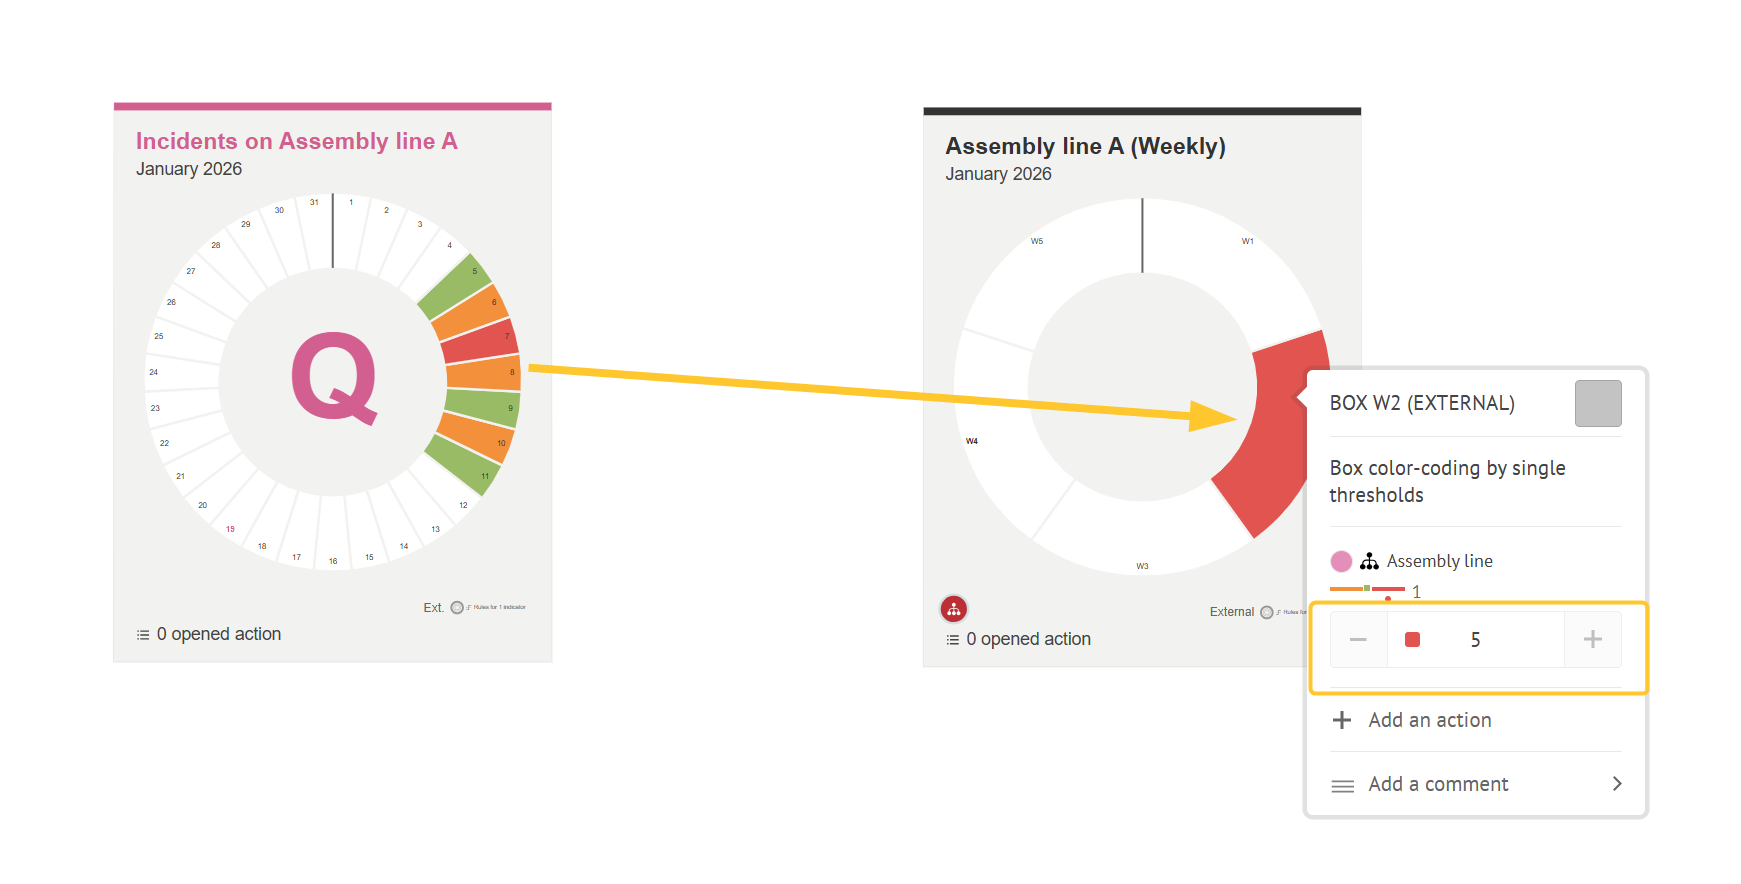
Global Sum: sum of all daily values
1 + 0 + 2 + 0 + 1 + 0 + 1 = 5 incidents per week
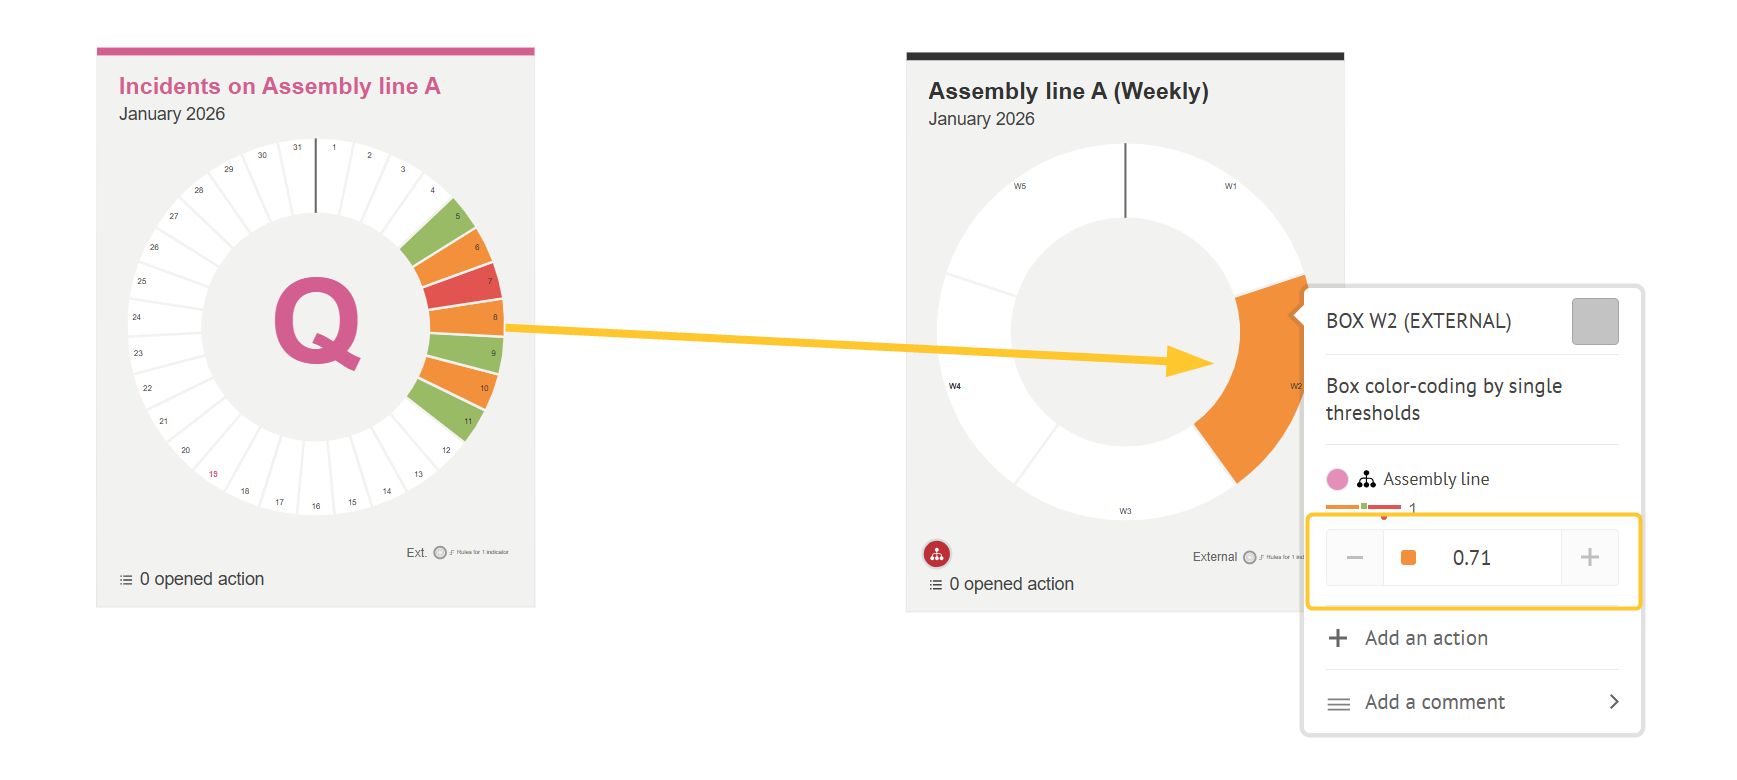
Simple Average: calculates the average value for the week
Total = 5 incidents ÷ 7 days = 0.71 incidents per week
Min / Max: selects the lowest or highest value in the week
Min = 0 per week
Max = 2 per week
.png)
Impact of Aggregation on Consolidation
Aggregation affects the final consolidated result.
Consolidation merges these aggregated values to create an overall recipient indicator.
Lifecycle
Some elements may be changed over time, after the consolidation is setup and running. In this case, when you open the consolidation setup window, some indicators may be displayed:
With an orange border, if a source indicator was renamed
With a red border, if the source indicator was erased or the user has no access to it
This may occur in case of data import-export.
Click Save.
Your consolidated view is created.