- 1 Minute to read
- Print
- PDF
Using QCD Pareto Chart
- 1 Minute to read
- Print
- PDF
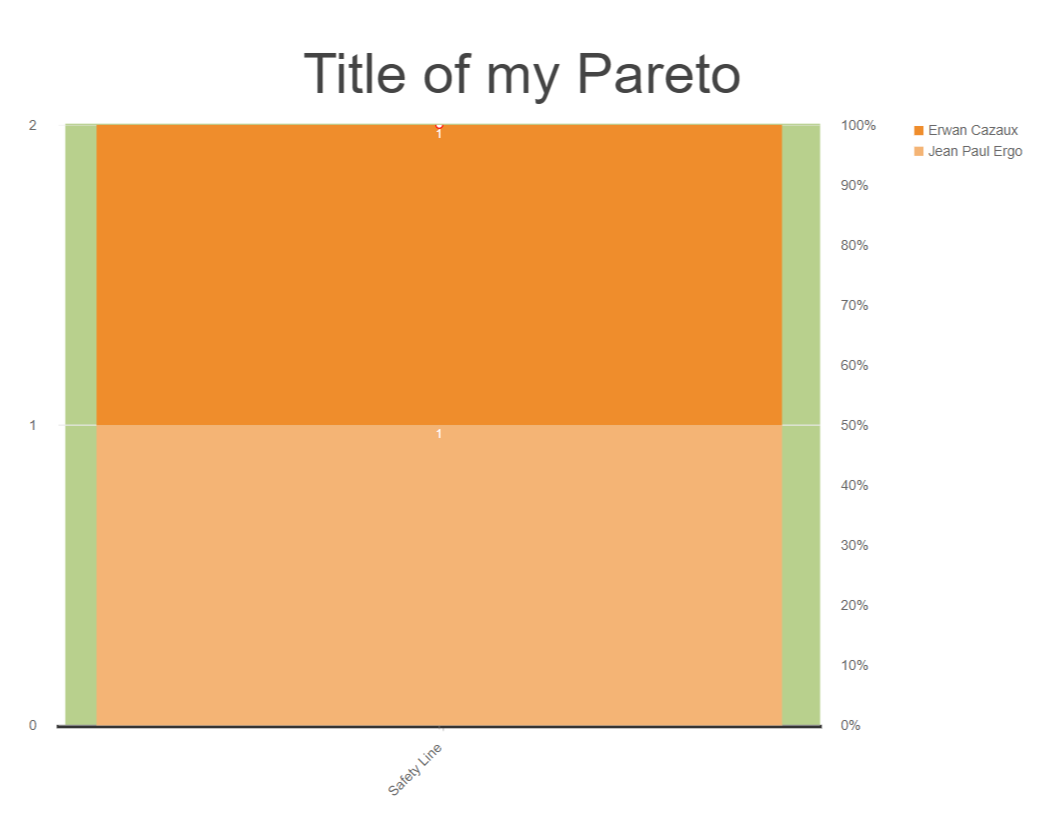
In iObeya, the Pareto chart is a tool designed for actions on a QCD board. With this graphical tool, you can visualize the 20% of causes responsible for 80% of the problems created on a QCD board, in line with the Pareto principle.
This article explains how to access the QCD Pareto chart and use it to optimize your analyses and action plans.
Accessing the Pareto Chart
This tool is present by defaut in your board’s dock, as are the other QCD elements.
Using Pareto Chart
To use Pareto chart:
Drag and drop it onto the board.
Start configuring it:
.png)
Enter the chart name.
Define the X axes of this chart: select the first filter, which corresponds to the same options as those present on QCD actions plans.
With the second filter, you can refine this Pareto chart if needed.
Set the threeshold if necessary. See Using indicators thresholds of the Configuring letters to find out more about how to configure the threshold.
Select color combinations identical to those on QCD charts.
Click Save.
Your Pareto chart is ready to be used.

Note:
This Pareto chart:
only works at the board level and with the actions present on that board, whether or not they are linked to a letter, escalated or simply present within a letter.
is not updated automatically at present, but you can update it manually: click Update this pareto in the contextual menu.


.png)
